Categories
Enterprise 2.0 Featured Articles

Benchmarking the Social Intranet

Benchmarking the Social Intranet.

Of late, I’ve been crunching some numbers. My aim is simple – how to get a better sense of what adoption figures mean and how we might begin successfully benchmarking the social intranet. The inspiration for the exercise came from a call with Gia Lyons and Claire Flanagan of Jive Software and I’d like to thank them for providing the means to apply some ratios to a social business platform roll out for internal collaboration, i.e. the social intranet.

For my example I’m going to use some of the key adoption metrics generated  from Jive’s Community Manager Reports (CMR) tool. These are as follows:

Name Description
Active Users who have viewed at least one item in the previous 30 days
Participating Users who have commented, liked, rated/voted, edited, or created content in the previous 30 days.
Contributing Users who have created new content (blogs, wikis, threads, video etc) in the previous 30 days
Logged in users Users who have logged in at least once since site creation
Total users All system users, excluding disabled

Whilst these are how Jive provides core reporting, they could equally well apply to IBM Connections, SharePoint, Blue Kiwi or any other social business platform.

The Social Business Adventure of Five Fictional Companies

To bring this exercise to life, I’ve created some adoption data tables for 5 very different companies.These are fictional entities constructed for this exercise but all are in sectors that I’ve engaged with in social business projects over the last 15-20 years or so , namely, technology, education, finance, media and energy.  Given this, I can apply some insight into these companies but I must state that some of the adoption rates are aspirational! The companies are as follows:

American Gasoline (AG): global oil and energy company
Royal Bank of Ireland (RBI):
an EU bank
Silicon Valley Circuits (SVC): a leading tech company.
Media Moguls (MM): a successful media company
University of Chiswick (UoC): a prestigious UK university

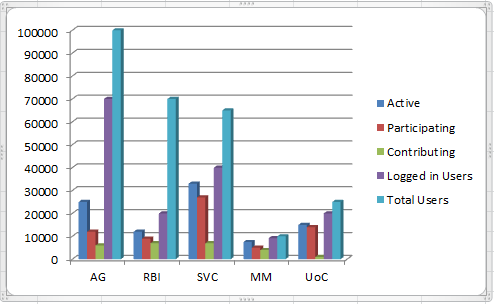
The adoption rates for these companies are as so:

Active Participating Contributing Logged in Users Total Users
AG 25000 12000 6000 70000 100000
RBI 12000 9000 7000 20000 70000
SVC 18000 12000 7000 50000 65000
MM 7500 5000 4000 9200 10000
UoC 9000 8000 1000 20000 25000


As a bar chart, this looks like this:


What are we to make of these figures, how well are each doing and how do they benchmark?

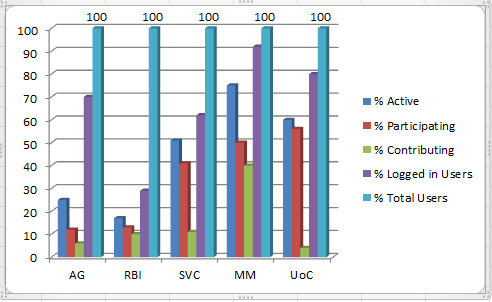
Representing Social Business Adoption as a Percentage

The first thing we need to do is turn these figures into percentages.  Taking the total users in the system as 100%, we get the following table:


% Active % Participating % Contributing % Logged in Users % Total Users
AG 25 12 6 70 100
RBI 17 13 10 29 100
SVC 28 18 11 77 100
MM 75 50 40 92 100
UoC 36 32 4 80 100


Benchmark 1: How many employees are using the site?

This is based based on conversations at the Social Business Council and research conducted there earlier in the year by Susan Scrupski. The basic consensus is that we should aim for getting half of our employees at least viewing material in the site in a 30 day period – Jive’s Active Users.

What percentage are Active Users?
Aim for getting 50% of employees viewing content in any 30 day period


As we can see here, in only one of my examples, Media Moguls, has this been achieved. This is not uncommon – I comment I hear often from other people working in driving social business adoption is that getting to 50% is very difficult. In some ways it’s a crude but pretty indicative mark – is the site being at least viewed by most the employees?

Benchmark 1: a target 50% of employees viewing content in a 30 day period.

Benchmark 2: How widely is the social business platform rolled out?

This benchmark is a simple and effective measure of how widely the social business platform has been rolled out. You might well get a situation where there’s a very lively and value-creating community but where this is an enclave with the company. Here we’re looking at the total possible universe of users and how many have ever logged in. The total universe is all those who can have access – (most likely the total in Active Directory, as below). Jive’s figure here is that 90% should have logged. When we look at our communities this is how they pan out:

How many have never logged in? This should be less than 10%


On this benchmark only the Royal Bank or Ireland and Media  Moguls are doing well. At American Gasoline, a third of all people in the company have never logged. Clearly there’s some wider internal communications work needed here to expand the community out and to get people using the site.

Benchmark 2: 90% of employees should have logged in to the social business platform

Benchmark 3: How active are communities?

The  benchmark I’m going to apply measures how active the communities are. So far we have useful benchmarks on the very big picture but in order to get a clearer comparative overview of the companies, we need to apply some further measures. These will then allow us to start to benchmark their actual performance against each other in terms of the sites themselves.

What we’re trying to find out here is how active the people currently using the community actually are. The way this is calculated is take the total who have ever logged in as 100 and then calculate percentages of Active, Participating and Contributing Users against that. The % Jive think should be active here is 50% or more. This is important to separate out Logged in from Total System users, in that for many companies, the total number of system users are as likely as not being pulled in from Active Directory by an LDAP synch. As we saw above, the system users might not even know the site exists. What we need to know therefore is, of those who have logged in, how does their activity and thus the site, fare?

So how do our communities measure up?

Social Business Activity of those logged in


The result is patchy. If 50% is the benchmark figure for Active Users, against those who have ever logged in, then we can see that only Media Moguls and the Royal Bank of Ireland have achieved that figure. Of the rest, the majority of people who have ever logged in have not returned in the last 30 days. And remember, Active users in Jive’s terminology is just those who have viewed something. If we’re looking at those generating new content or commenting on existing content then the figure is even lower.

Benchmark 3: the number of Active Users should be 50% or higher when measured against those who have ever logged in.

Benchmark 4: Is the site more than just somewhere to visit?

The final benchmark left me a bit incredulous at first as I thought it unrepresentative of a lot of the communities I’d seen. It certainly seemed a stretch goal at first. What this benchmark provides is a way of seeing if the site is being used by just a handful of people or whether it’s being used by a lot of people as a potentially useful business tool.

To provide more depth to this benchmark it might well be necessary to flesh it out by looking at what people are doing and whether the site is simply a document store or being used for effective collaboration. Nonetheless this is a useful measure – what we’re after seeing here is how much people many of the users are actually creating new materials rather than just viewing or commenting on existing documents and discussions. In my opinion it’s a very good measure of the health of the community and how embedded its use is in day to day activities by a wide group of people. Certainly, if a community met this benchmark then it would be a strong sign of successful and wide usage.

What this benchmark looks at is the number of people creating new content, Jive’s Contributing Users, against the number of Active Users. For Jive this figure should be 75%. When we look at our communities this is how they fare:

Contributing Users
How widely used is the site for actually creating new materials and collaboration?


As we can see here, none of the communities meet this mark. Royal Bank of Ireland does best here with nearly two thirds of the community using it to generate new stuff. At the University of Chiswick however, only a tiny proportion of the community are creating new items.

Now it might be argued that a social intranet will follow the pattern of the consumer web with Altimeter’s 90:9:1 rule, showing a small proportion creating genuinely new content and the majority of users simply lurking. The difference here though is that we’re looking at a business tool. If the tool is successfully embedded into day to day business then why are the majority of users not using it to create new materials? Are they not making new stuff (unlikely) or are they making them and collaborating using e-mail? Either way, this is indicative of how people are using the site – is it a business tool or a lurker’s paradise?

Benchmark 4: the number of User creating new content (Contributing Users) should be 75% or higher, against the number of Active Users.

Conclusion

There may well be mileage in producing target ratios against the 90% we expect to have logged in or other such measures. Whilst I’m tempted to start extrapolating out more figures from my fictional companies, especially around and usage, or even providing them with working strategies to address their different challenges, I shall stop here. Maybe for future posts.

These figures are of course somewhat heavy handed (the term ‘Instrumental Reason’ comes back from my Critical Theory days)  so please see Deb Lavoy’s excellent article in CMS Wire 2013 Prediction: Social Business Tech will Stop Blaming Culture for Failure for a more nuanced look at the value social business we can bring to the table rather than just the numbers.

Nonetheless I do think they provide a useful way to make sense of Jive’s Community Manager Reports and to measure the success of a social business platform against industry norms. In the future it might be possible to get anonymous feeds from Jive’s CMR of the data that could then feedback into CMR about how a community was doing. In the meantime we have Excel and calculators – (and please let me know if you spot any errors in my arithmetic! ) and at least privately, how your real communities measure up against the ones here. And also, if you have your own benchmarks to share, please do let me know.

@theparallaxview

Categories
Enterprise 2.0 Featured Articles Intranet

Intranet Bounce Rate

Of late I’ve been spending some time looking at the Intranet Bounce Rate on an enterprise social media project I’m working on for a large multinational. And by Bounce Rate, (rather than Intranet Bounce Rate), I’ll take the definition found on Wikipedia today:

It essentially represents the percentage of initial visitors to a site who “bounce” away to a different site, rather than continue on to other pages within the same site.
The formula used to calculate bounce rate is: Bounce Rate = Total Number of Visits Viewing One Page ÷ Total Number of Visits

The metrics produced by Google Analytics look quite good to me, at least bythe usual  industry standards:

Bounce Rate

As the Wikipedia article cites, this is very good indeed:

Google.com analytics specialist Avinash Kaushik has stated:
“It is really hard to get a bounce rate under 20%, anything over 35% is cause for concern, 50% (above) is worrying.”

But is this good for an intranet bounce rate, or enterprise social network site? A high bounce rate on a large corporate intranet might mean that users are happiest when they bounce away quickly as they’ve found what they want. Here high Bounce Rate = Good? On an enterprise social network site, well what does intranet bounce rate really mean?

Both Bing and Google offer nothing on this that I could see. Indeed when I search for ‘Intranet Bounce Rate’ on Google, it kindly asks – ‘Did you mean Internet? ‘!!

p.s. One interesting point – Saturdays generate the high spikes.  Why?

p.p.s. Some excellent resources from my old colleague at Derby Uni, Dr Dave Chaffey to mull on. Bounce rates in Web design articles

Categories
Analysts Communications Enterprise 2.0 Featured Articles

Nielsen’s internet footprint – a toe in the water at work?

The latest report from Nielsen, Social Networking’s New Global Footprint showing the growing normalisation of social media in internet use is of interest for several reasons. Most notable the age demographics refutes the fallacy that this is a novelty for young male users. The broad median of users extends from 38-49 across both sexes and shows a significant number of users in the 50-64 range, with the majority there being female.

Mobile time

Secondly, the report shows an increase in mobile use, particularly in Japan, where devices such as the iPhone are seen as a bit primitive, especially when compared to the functionality of the average Japanese fliptop phone. Finally, Nielsen note the increasing amount of time spent on these networks, this is increasingly not a flitter visit by users.

Implications for Internal Communications

So, what are we to make of this for the workplace? The most important aspect is the demographics. Most 2.0 literate internal communications professionals today, will have had experiences where 2.0 was dismissed as “not something our middle-aged managers will ever bother with”. One more case of refuting this. And whereas previous observers have remarked on the need to provide the same sort of tools and collaborative experience for Gen Y entering the workplace, the same could be applied to Boomers already there. If we can edit a website in seconds at home, why does it take a week or 2 at work?

Blue collar workforce

The enhancement of mobile use is also of note. As these things get better, even outside Japan then so their use will increase.This will have a knock-on effect for the the workplace. Put a WiFi device in a wireless work environment and even those not usually connected to a PC can be part of an electronic communication and collaborative environment.

Moore’s Mighty Woosh

Of course this does all presume a connected, e-savvy workforce. My point about WiFi ushers in the possibility of blue collars being connected with cheap(er) devices. Indeed I use my iPod Touch as a poor man’s smartphone and it works well as I move from wireless zone to zone. Why not then the same at the workplace? Even if the full impact of the tectonic shift – Moore’s great ‘Woosh’ isn’t there yet in the workplace, it sure is everywhere else, well everywhere that has the internet.

Not on the phone

On this we ought to be mindful of the fact that most people globally are not online. What we’re talking about here is for those countries and workforces that are already industrialised. Chomsky used to like to remind us that not only have the majority of people alive today never been online, most of them have never made a phone call. I wonder if this has changed much and if so by how much in the last decade?

Categories
Communications Enterprise 2.0 Featured Articles Intranet

Microsoft Surface Launches in EMEA – whither the Intranet?

news out from CeBIT that Microsoft has launched Surface in Europe: Microsoft Surface gets EMEA launch

As a result of a previous posting on Twitter I was sent the video below by @joshblake I’ve also been chatting with Paolo Tosolini –@Tosolini who has been doing some great work with Microsoft on video casting and using Microsoft Surface as a comms tool – (please see previous post).

Moving on from yesterday where I conjectured about the intranet browser of the future, the video below maybe shows why technology may just yet leap frog over any such solution. When I watch Microsoft Surface in action I keep thinking, what will this do for internal comms and the intranet of the future?

Categories
Communications Enterprise 2.0 Featured Articles Intranet

Intranet Browser of the Future

Funny really when you think about it, a lot of time, effort, blood, sweat and hard cash budget goes into the intranet itself, the CMS, the platform and portals, etc., etc., but little all goes into the browser. What of the Intranet Browser? A few searches on this shows not a lot being done, apart from one notable exception Shiv Singh at the AppGap Intranets are not just intranets anymore. Here Shiv rightly to my mind, talks about the core business functionality and says that:

Today, employees demand more consolidated interfaces where all the information, collaboration, self service and business application access needs are met.

This is certainly so, but for Shiv this is ‘post-browser’ issue and ultimately a question about ownership within the corporation and a need to realign to meet employee, not application or dept needs. Yes, indeed, this is an item I plan to write on shortly, but for the time being I think one needs to ask if this is really going to happen. I for one won’t be holding my breath here. There are possibilities – WebEx Connect for example, or Microsoft’s Surface Table technologies, but for the time being, let’s get tactical.

Getting Tactical

I think there’s a low hanger ready to be scrumped in terms of Shiv’s one stop consolidated interface, in terms of what we can do with the browser now. The model I believe is Flock. I’ve written before about the way that Flock so neatly integrates RSS into the browser experience and that if this was more widely adopted in the enterprise then tales of RSS’s death might certainly seem to be exaggerated (Kick my RSS – How to make Enterprise RSS work). But, and it’s a but as big as Galway Bay, why stop there? Why not use Mozilla technology to do what Flock has done for the average social media savvy punter and do the same for the enterprise?

Enterprise Social Network Browser

This is what I’d have in my Intranet Browser of the Future:

1) At the top left there would be a series of buttons to access the core built in functions. These button would provide access to function bars such as RSS

accounts

2) There would also be a direct hard wired button to Directory. The Directory would have full Tagging and self-personalisation functionality

3) This tagging would tie in to other social media tools, all accessible from the browser. One would be Favourites – my personal and social bookmarks that I could share with my colleagues

4) I would naturally also be able to connect a wide range of other enterprise social network tools, not only bookmarks, but also my internal corporate blog, my forums, my videos, etc etc. In the corporate example these would be Yammer or Jive, all or a mix. The key thing is the access to their functionality is hard-wired into the Browser, not the apps.

social-tools1
5) So continuing in the same logic, all the corporate video and streams would be available within the browser – these could be live IPTV shows, streamed Video on Demand (VoD), or user generated YouTube type video.

youtube1

And so on and so on. To reiterate, the Browser holds all this together to create the ‘consolidated interface’. It’s a Pareto fix I grant, but 80% consolidation in the near future would be better than waiting indefinitely for the full delivery.

Apologies for the duff formatting – I need to look at how WordPress is handling images.

Categories
Communications Enterprise 2.0 Featured Articles

How Microsoft Surface video to win deals

Using internal comms video to empower and inform a highly mobile and technically savvy workforce is one of the things I’ve spent a lot of career years on, so it was with keen eyes that I watched a Microsoft Surface video on how they’re doing it with cutting-edge surface table technology. The results look funky and efficient. I’d like to know more about how it all fits together. The questions that come to mind are:

How is the information is structured behind the creatives?

What the field sales guys reckon – nice or must have?

Tagging – I like tagging – what’s going on here? There looked like a means of synching up the info across multiple devices inc iPhones. This was the killler app I always wanted to provide our field sales guys with – don’t bombard but synch up so that the devices know when a message has gotton through. This looks like it delivers.

But delivery – is it push or pull, how do they find out about new content, how good is the engine behind it all?

It’s a good job that the presenter is on Twitter so I can now follow @tosolini and learn more…;-)

Categories
Communications Enterprise 2.0 Intranet

What should we call ‘Intranet Social Media’?

e2We have ‘Internal Communications’ as a reasonably well-established term for what happens inside the corporation, be it in vocal, print or electronic media forms. I’ve even found a nice and almost legalistically comprehensive definition from BNET:

communication between employees or departments across all levels or divisions of an organization. Internal communication is a form of corporate communication and can be formal or informal, upward, downward, or horizontal. It can take various forms such as team briefing, interviewing, employee or works councils, meetings, memos, an intranet, newsletters, the grapevine, and reports.

A further Google on just how long the term has been in existence has proved fruitless though, Miriam Webster has no definition and the Free Dictionary reverts to a revealing and accurate comparison, that of Internal Combustion:

a process in which a substance reacts with oxygen to give heat and light [!]

All the more problematic then when we come to social media. Social media is by definition, social. It happens out there, in the public sphere on Facebook, MySpace, LinkedIn, Wikipedia, Twitter, Countless Blogs, forums, feeds , etc., etc.,. But as I’ve pointed out before, what we don’t see a lot of, is social media behind the firewall.

What’s more, we don’t even have a proper name for internal social media, social media that lives inside the firewall. Enterprise 2.0 goes someway in the direction but it seems to me at least as being too Operations driven rather than communication and collaboration lead. It also falls into the same trap as Web 2.0 and seems to curtail the simple richness that the term ‘social media’ has. Finally, it sounds, well just a bit too grand!

I suspect for now that Enterprise 2.0 will be the dominant term, but I wonder if a new, possible neologism will arrive…maybe social medianomics or some other horrid transmutation of the English language!

Is Enterprise 2.0 OK? Or, ideas on a postcard please….