The first usage in any meaningful sense is from Karin Knorr-Cetina:
Knorr Cetina, K. (1997). Sociality with objects: social relations in postsocial knowledge societies. Theory, culture & society, 14(4), 1-30.
The entire concept is based on the theories of Jacques Lacan:
“The Lacanian ideas I use serve to specify objectual relations, which I see as the touchstone of an object-centered sociality, as relationships based upon a form of mutuality: of objects providing for the continuation of a chain of wantings, through the signs (what Lacan calls signifiers) they give off of what they still lack; and of subjects (experts) providing for the possibility ofthe continuation of objects which only exist as a sequence of absences, or as an unfolding structure.”
Lacan appeals as Knorr Cetina rejects commodification as a based on an superseded mode of alienation:
“Yet the contemporary culture of “self-fulfillment” hardly seems to be reducible to the phenomenon of alienation. More importantly, what lies at the core of the Marxian notion of a commodity is the alienation from the products of one’s labor. But the properties that characterize objectual relationships in expert work would seem to be exactly the opposite: non-alienation and identification. Thus the concept of alienation is a suspect one when applied to the relationship of an expert to the objects of expertise.”
What if she has misread this understanding of alienation? Is there a richer reading of the social object not as as the denial but the achievement of this alienation?
If you want to master the measurement of Social Business ROI (SocBiz ROI), you need to master IC ROI and employee engagement as a metric of overall performance and productivity. The art is in tying the two together. I like Melcrum in this respect, lots of useful resources to draw on: e.g., Measurement Matters. Demonstrate value to remain relevant
One of the issues we best not to forget, is the simple fact that social business benchmarking is by necessity, always done against a fluid and changing backdrop. The benchmark applied against a mature social business community for example, will be different to that applied to a more recently formed one. In addition, the benchmarks themselves, inevitably drawn from the aggregation of industry best-practice in terms of both data and the stories we tell about our communities will themselves change over time. Used correctly, this information when applied back to the social business projects will change them, hopefully for the better, and thus raise the bar on what we all want to achieve.
The 90–9–1 principle does not apply to social business
Equally important is the fact that while social business might be driven by the wider consumer driven social web, these are very different entities. A social network at work is very different in fundamental ways to a universally accessible consumer network. The former is by its nature private and closed, at least to some extent, one has to be an employee to access for example, the numbers are finite and their limits easily seen. For this reason alone, we must abandon the use of the 1% rule for employee based engagement measures – the 90–9–1 principle does not apply to social business.
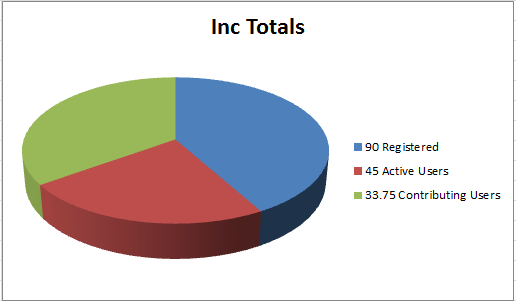
We can see this more clearly when we look at the application of social business benchmarks that I discussed in a previous post Benchmarking the Social Business. To recap, of our finite possible community, ( i.e. the number of people who can at least in theory log into our social business platform, most often the total people in AD), 90% of these should have logged in at least once. Of these, 50% should be Active Users, having logged in and viewed content in the last 30 days. And further, of these, no less than three quarters should be what Jive call Contributing Users, that is, those generating original content in the previous 30 days. We can easily represent this in a fictional company of 100,000 employees. Some 90K of these should have logged in at least once, half of these, i.e, 45K should be Active and three-quarters of these should, at least by Jive Software’s benchmarks, be Contributing Users. That figure comes out at around a third of all users, some 33,750 employees. Taken as a whole we get this table:
Totals K
Users
Calc %
100
System Users
100
90
Registered Users
90
45
Active Users
50
33.75
Contributing Users
75
Thus, rather than 1% as creators of original content, we get 33% of all employees generating new content – starting discussion threads, posting blogs, creating documents etc (though not including status updates). This correlates more closely to Pareto than the 1% rule.
Two salient points. Firstly, Active Users includes Contributing ones. This is partly because of the way Jive’s Community Manager Reports works, but it also it makes more sense that way. I will in a future post try and extrapolate this out in more detail.
The second point is more prosaic – even if it’s agreed that 1% of employees actually using these tools for primary generation of content, this is in industry terms still a very high figure. These are the sort of figures we can expect to see in a very mature social business platform, in practice it takes a lot of hard-work and time to get these sorts of results.
Ratios of engagement for Social Business Benchmarking
For this reason, I believe we need a series of benchmarks or different ratios to correlate with the maturity- if a community is a year old and has not enjoyed cross-company C-Level push it ideally needs (and this is not uncommon, particularly in politically tense terrains), we might well have a situation where only a minority have ever logged in and of these only a minority again are generating new content. Thus a freshly released platform we are more likely to see a roll-out pattern, that while more closely relates to the 1% rule, is nonetheless a signal of immaturity and the need for fuller engagement. I will explore this in more detail in future posts.
Increase employee engagement via genuine dialogue and polyphonic communication channels. Overcome Generational Shift. Discussing!
Employee Satisfaction Surveys, Polls, Feedback from Social Media Channels (% Csat), CSAT on Generation – Y + Millenials + Boomers. Timkin’s 5 I’s: Inform, Inspire, Instruct, Involve, Incent.
Platform Usage
Using the social platform to collaborate, innovate and share
Core platform metrics, logins & actions: ‘Contributing, Participating and Active’ Users; content posting, number of discussions, blogs, wikis, documents created; documents, images, video uploaded; Groups, Communities & Spaces created. etc.
Innovation
Increase level of innovation via Innovation Wikis (e.g., Cisco I-Zone), Competitions and ‘wisdom of crowds’ gathering of info activities. Listening!
Number of ideas submitted, number of successful ideas turned into pilots, number of pilots entering the market as new products. Time to market ratios.
Increase Productivity
Increased productivity
% increase, contribution in $/£ per employee
Improve Customer Experience
Increase revenue per customer, increase engagement from the customer, social marketing, brand protection
Customer retention / satisfaction, inputs into marketing process, overall cost of marketing $/£ per $/£ sale. Brand insurance.
Social Engagement
Connections, sociality of employees via Enterprise Social Networks, 2.0 profiles, Tagging across the Enterprise, Expert Locators, Silo Busting
Social Network Analytics, (NodeXL), Measure of Relations, Overcoming Geo/Time barriers with synchronous & asynchronous comms / collaboration = decreased travel budget. ratio of flights/meetings vs online engagement.
Learning
Social Learning, sharing of information, 2.0 Training, e-learning, EMS.
Cost of training, number of courses taken/passed, diversity of learning offerings, Customer satisfaction/CSAT Degree of ‘Knowing what we know’ better.
Sales & Turnover
Social Software as cumulative competitive Advantage. Increased Sales and Turnover + Productivity
Sales figures, sales generated per employee at employee cost (as above inc productivity).
Information Flows
“Semantic analysis, Big Data techniques and better tracking in general will help us to develop better insight into the who, what, when, where and why of information flow. In other words, how much of the right stuff is getting to the right place in the right context and the right time? Can we depend on it and when? Can we juice the system? Can we game it? How?” Deb Lavoy – see below
TBC
Notes and Updates
Added to this framework: core platform usage – this should always have been part. The second is Bruce Timkin’s 5 I’s of employee engagement. The third is information flows. Information flows are something I need to articulate – it’s one of those slow-burner ideas, formulated in part when I was engaged with Critical Theory and Continental Philosophy. Thanks to Deb Lavoy for Timkin and for reminding me on flows. In doing so, this could lead to a need to synergise some of the headings.
Please see Balanced Scorecard search for my ‘working out loud’ on this topic over the last few years. Next phase will bring in ‘Big Data’ and look at closing the loop in terms of employees, customers and partners for the more holistic view of the social business.
I forgot to thank my colleagues in the Social Business Council for recent inspiration. We have a catch-phrase of ‘Working out Loud’ which Bryce Williams coined as so:
Working Out Loud = Observable Work + Narrating Your Work
I guess I’ve always done this to some extent – this blog can be a bit of a jotter of dropping ideas into as it’s all too easy to get and then forget a good idea, or to simply work away inside a megacorp and one’s work not get seen by the outside, wider world.
The more recent spur to action was from fellow councillee John Stepper who draws on Bryce’s work and formulates working out loud as a ‘personal content strategy‘ and as ‘free career insurance‘.
For me there’s also a redemptive and liberational aspect to this. I’ve kept this to myself until now, but it’s the concept of ‘working allowed’ and actually saying what one thinks. That is after all what the power of social is all about. We can express ourselves (nothing new there of course), but also share ideas in a global, near synchronous way (or asynchronously and respond many months later), and above all to learn and develop.
Of late, I’ve been crunching some numbers. My aim is simple – how to get a better sense of what adoption figures mean and how we might begin successfully benchmarking the social intranet. The inspiration for the exercise came from a call with Gia Lyons and Claire Flanagan of Jive Software and I’d like to thank them for providing the means to apply some ratios to a social business platform roll out for internal collaboration, i.e. the social intranet.
For my example I’m going to use some of the key adoption metrics generated from Jive’s Community Manager Reports (CMR) tool. These are as follows:
Name
Description
Active
Users who have viewed at least one item in the previous 30 days
Participating
Users who have commented, liked, rated/voted, edited, or created content in the previous 30 days.
Contributing
Users who have created new content (blogs, wikis, threads, video etc) in the previous 30 days
Logged in users
Users who have logged in at least once since site creation
Total users
All system users, excluding disabled
Whilst these are how Jive provides core reporting, they could equally well apply to IBM Connections, SharePoint, Blue Kiwi or any other social business platform.
The Social Business Adventure of Five Fictional Companies
To bring this exercise to life, I’ve created some adoption data tables for 5 very different companies.These are fictional entities constructed for this exercise but all are in sectors that I’ve engaged with in social business projects over the last 15-20 years or so , namely, technology, education, finance, media and energy. Given this, I can apply some insight into these companies but I must state that some of the adoption rates are aspirational! The companies are as follows:
American Gasoline (AG): global oil and energy company Royal Bank of Ireland (RBI): an EU bank Silicon Valley Circuits (SVC): a leading tech company. Media Moguls (MM): a successful media company University of Chiswick (UoC): a prestigious UK university
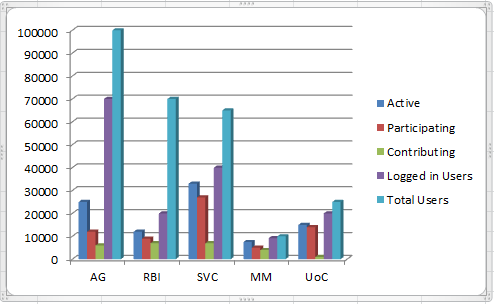
The adoption rates for these companies are as so:
Active
Participating
Contributing
Logged in Users
Total Users
AG
25000
12000
6000
70000
100000
RBI
12000
9000
7000
20000
70000
SVC
18000
12000
7000
50000
65000
MM
7500
5000
4000
9200
10000
UoC
9000
8000
1000
20000
25000
As a bar chart, this looks like this:
What are we to make of these figures, how well are each doing and how do they benchmark?
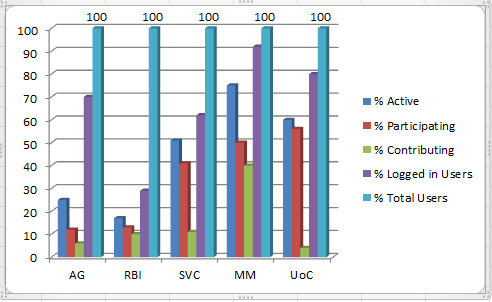
Representing Social Business Adoption as a Percentage
The first thing we need to do is turn these figures into percentages. Taking the total users in the system as 100%, we get the following table:
% Active
% Participating
% Contributing
% Logged in Users
% Total Users
AG
25
12
6
70
100
RBI
17
13
10
29
100
SVC
28
18
11
77
100
MM
75
50
40
92
100
UoC
36
32
4
80
100
Benchmark 1: How many employees are using the site?
This is based based on conversations at the Social Business Council and research conducted there earlier in the year by Susan Scrupski. The basic consensus is that we should aim for getting half of our employees at least viewing material in the site in a 30 day period – Jive’s Active Users.
Aim for getting 50% of employees viewing content in any 30 day period
As we can see here, in only one of my examples, Media Moguls, has this been achieved. This is not uncommon – I comment I hear often from other people working in driving social business adoption is that getting to 50% is very difficult. In some ways it’s a crude but pretty indicative mark – is the site being at least viewed by most the employees?
Benchmark 1: a target 50% of employees viewing content in a 30 day period.
Benchmark 2: How widely is the social business platform rolled out?
This benchmark is a simple and effective measure of how widely the social business platform has been rolled out. You might well get a situation where there’s a very lively and value-creating community but where this is an enclave with the company. Here we’re looking at the total possible universe of users and how many have ever logged in. The total universe is all those who can have access – (most likely the total in Active Directory, as below). Jive’s figure here is that 90% should have logged. When we look at our communities this is how they pan out:
How many have never logged in? This should be less than 10%
On this benchmark only the Royal Bank or Ireland and Media Moguls are doing well. At American Gasoline, a third of all people in the company have never logged. Clearly there’s some wider internal communications work needed here to expand the community out and to get people using the site.
Benchmark 2: 90% of employees should have logged in to the social business platform
Benchmark 3: How active are communities?
The benchmark I’m going to apply measures how active the communities are. So far we have useful benchmarks on the very big picture but in order to get a clearer comparative overview of the companies, we need to apply some further measures. These will then allow us to start to benchmark their actual performance against each other in terms of the sites themselves.
What we’re trying to find out here is how active the people currently using the community actually are. The way this is calculated is take the total who have ever logged in as 100 and then calculate percentages of Active, Participating and Contributing Users against that. The % Jive think should be active here is 50% or more. This is important to separate out Logged in from Total System users, in that for many companies, the total number of system users are as likely as not being pulled in from Active Directory by an LDAP synch. As we saw above, the system users might not even know the site exists. What we need to know therefore is, of those who have logged in, how does their activity and thus the site, fare?
So how do our communities measure up?
The result is patchy. If 50% is the benchmark figure for Active Users, against those who have ever logged in, then we can see that only Media Moguls and the Royal Bank of Ireland have achieved that figure. Of the rest, the majority of people who have ever logged in have not returned in the last 30 days. And remember, Active users in Jive’s terminology is just those who have viewed something. If we’re looking at those generating new content or commenting on existing content then the figure is even lower.
Benchmark 3: the number of Active Users should be 50% or higher when measured against those who have ever logged in.
Benchmark 4: Is the site more than just somewhere to visit?
The final benchmark left me a bit incredulous at first as I thought it unrepresentative of a lot of the communities I’d seen. It certainly seemed a stretch goal at first. What this benchmark provides is a way of seeing if the site is being used by just a handful of people or whether it’s being used by a lot of people as a potentially useful business tool.
To provide more depth to this benchmark it might well be necessary to flesh it out by looking at what people are doing and whether the site is simply a document store or being used for effective collaboration. Nonetheless this is a useful measure – what we’re after seeing here is how much people many of the users are actually creating new materials rather than just viewing or commenting on existing documents and discussions. In my opinion it’s a very good measure of the health of the community and how embedded its use is in day to day activities by a wide group of people. Certainly, if a community met this benchmark then it would be a strong sign of successful and wide usage.
What this benchmark looks at is the number of people creating new content, Jive’s Contributing Users, against the number of Active Users. For Jive this figure should be 75%. When we look at our communities this is how they fare:
How widely used is the site for actually creating new materials and collaboration?
As we can see here, none of the communities meet this mark. Royal Bank of Ireland does best here with nearly two thirds of the community using it to generate new stuff. At the University of Chiswick however, only a tiny proportion of the community are creating new items.
Now it might be argued that a social intranet will follow the pattern of the consumer web with Altimeter’s 90:9:1 rule, showing a small proportion creating genuinely new content and the majority of users simply lurking. The difference here though is that we’re looking at a business tool. If the tool is successfully embedded into day to day business then why are the majority of users not using it to create new materials? Are they not making new stuff (unlikely) or are they making them and collaborating using e-mail? Either way, this is indicative of how people are using the site – is it a business tool or a lurker’s paradise?
Benchmark 4: the number of User creating new content (Contributing Users) should be 75% or higher, against the number of Active Users.
Conclusion
There may well be mileage in producing target ratios against the 90% we expect to have logged in or other such measures. Whilst I’m tempted to start extrapolating out more figures from my fictional companies, especially around and usage, or even providing them with working strategies to address their different challenges, I shall stop here. Maybe for future posts.
These figures are of course somewhat heavy handed (the term ‘Instrumental Reason’ comes back from my Critical Theory days) so please see Deb Lavoy’s excellent article in CMS Wire 2013 Prediction: Social Business Tech will Stop Blaming Culture for Failure for a more nuanced look at the value social business we can bring to the table rather than just the numbers.
Nonetheless I do think they provide a useful way to make sense of Jive’s Community Manager Reports and to measure the success of a social business platform against industry norms. In the future it might be possible to get anonymous feeds from Jive’s CMR of the data that could then feedback into CMR about how a community was doing. In the meantime we have Excel and calculators – (and please let me know if you spot any errors in my arithmetic! ) and at least privately, how your real communities measure up against the ones here. And also, if you have your own benchmarks to share, please do let me know.
For value to be realised in that customer experience, the organisation needs to increasingly become increasingly social, where the aim is to: “Fuse the external company brand with the internal corporate culture to create a consistent customer experience at all touch points.”
As the external and internal brand become unified – creating an holistic customer experience, collaboration across the firewall, uniting the customer community, the internal employee community and the creation of new products becomes central. Transparency and expertise location is key. Both data and people need to be findable. It’s this fusion and connect, between the customer and employee that drives and informs innovation.
To achieve this:
Collaborative tools need to be integrated into day to day business activities.
Innovation needs to be structured and plannned
Leaders need to communicate the big picture (and bridge the middle manager issue)
Social data is central to informing decisions. Analytics can be used to draw together traditional and social; hard and soft information.
Risk needs managing – brand, data leakage, employee behaviour, legal, security, privacy etc need planning, not after thought: “Successful companies identify potential exposures, proactively involve the right experts and develop risk management plans.”
Change management needs to nimble and to use the same social tools it tries to promote, whilst still retaining traditional change management processes. People need to be engaged, the inertia of the middle layer needs to be overcome. Narratives and the big picture are how we know where we are going.
There was a flurry of excitement a couple of weeks ago as the IT gang downloaded SharePoint 2013 (well OK I’m in IT too I grant, but I still think like the Business). There was much merriment as the IT guys exclaimed it was ‘just like Jive’…but ‘even better!’ Well the jury is well and truly out on that one, but while Jive’s response to the 2013 release has been very well publicised, I still wonder what their response will be in terms of product and market.
First blush SP2013 looks a lot better:
SP2013 admin options
It’s also clearly a lot more social in its perspective:
Share function SP2013
But aspects look very much like the old SP, which is not surprising really as these are core functions after all:
List Libraries SP2013
I couldn’t see anything looking like an activity stream however. The closest seemed to be workflows, which aren’t at all the same:
Workflows SP2013
More to follow – apologies for the dodgy layout – put together in a hurry!
I quite like the collection of number comparisons from MIT: Social Business by the Numbers. Some amusing comparisons – such as only 3% of companies are fully networked and yet the potential gains are McKinsey’s $1.3 Trillion. I wonder who are those 3% and just how networked they really are – well OK I know who they probably are and would question how much they really are…
Best stat comparison is between CEOs and CIOs. 48% of CEOs think social media is important or somewhat important to their business, whereas only half of CIOs think the same. This actually begs a lot of questions.
1) What do the other 52% and 76% think?
2) What would the ratio be if social media was replaced by the term social business or Enterprise 2.0 (we still have that naming thing)


